Before starting…
Please read carefully disclaimer page before reading site’s pages . Continuing in reading implies your full and unconditional agreement to disclaimer content . Site pages are daily updated around 09:00 am GMT . See also last updates on What’s new page .
Very Important!
Currency trends page now includes analysis on cryptocurrencies , the most capitalized and traded .That doesn’t imply an advice to trade cryptos , a very dangerous practice for your capital ; the only objective is to demonstrate that strategies based on markets’ actors behavior , in some periods can widely overperform particularly on those asset that are bought and sold on an emotional base , and this is the case of cryptocurrencies , whose value depends on ideas and previsions , having not a role as a national currency , nor backed by a material or safe background , or relying on a country’s economy ; and recent news about exchanges where these assets are traded show a lack of regulation in the matter , too .
Markets mood indicator
Indicators range from 0 to 100 .Overall from 0 to 50 indicates a negative mood , above 50 up to 100 a positive one . When Overall is very low (<25%) the odds of risky markets rebound are conversely high ; on the opposite side, an Overall reading above 75% likely shows risky markets’ overbought situation .
Last closing day

Last – 1 closing day

Dear Guest , we thank you very much for visiting our site ! Understanding the way financial markets evolve , has never been easy . We wish to walk with you along this path , putting our experience , about 35 years of passionate work in financial world , at your disposal , in order to build a better and non-conventional base for markets knowledge . Our effort will in reality consist in showing you , in a simple and clear manner , by over 250 charts and tables , what is behind the price movements , trying to derive from them the behavior of actors who are dealing and trading day by day .
What will you find?
In site’s pages , you’ll find various strategies to go deep in markets’ mood ; to summarize their content , assets can be divided in two classes . Cyclicals , whose positive phase are sign of a better market sentiment , and Defensive , whose strenght signals a weak mood .
What’s on top of this page?
This page’s top shows actual phases ; prevailing red colors prelude to a risk-off stance ; prevaling green colors underscore a positive mood . Time frame of analysis is short term (1-3 weeks) .Underlying quotes are updated at last working day . Strategies can be applied on a daily base . For a most comprehensive markets’ assets analysis , see related menu pages.
Please contact us if you would like getting analysis on assets you are in addition interested in , email addresses are on Contacts page .
| Strategies are updated daily , and are : Long only : Selection strategy , Weighted Alpha Modified ; Long-short : Strategy long-short , EMAs (exponential moving averages) Modified , Futures strategy , Risk strategy . All strategies don’t utilize leverage . That’s why every scenario needs a different strategy ; as to say , every season has its favourite clothings . |
Strategies probability in different trends
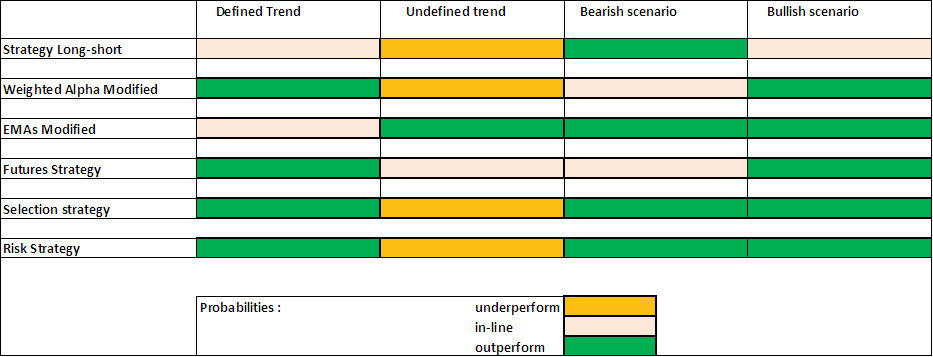
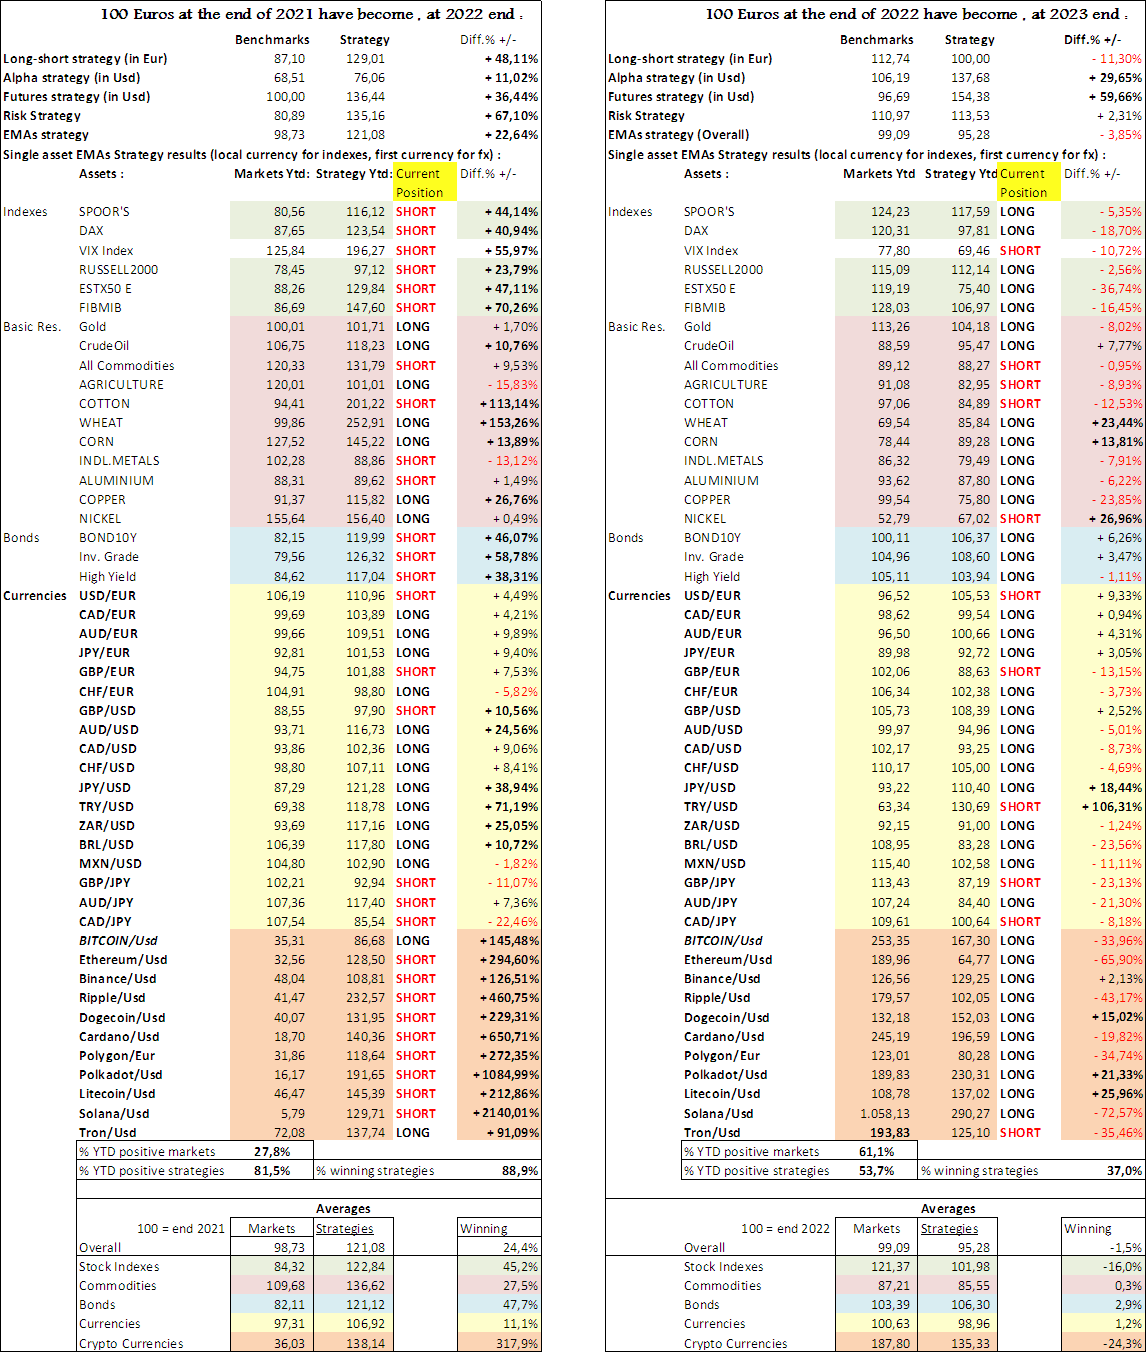
The following table and chart show the strategies’ year-to-date results .See also What’s behind page for strategies’background , and How to page for readings of performances and charts . Last changes in current positions are displayed on last column for each asset ( S > L from short to long , L > S from long to short) .

Strategies and Index trends

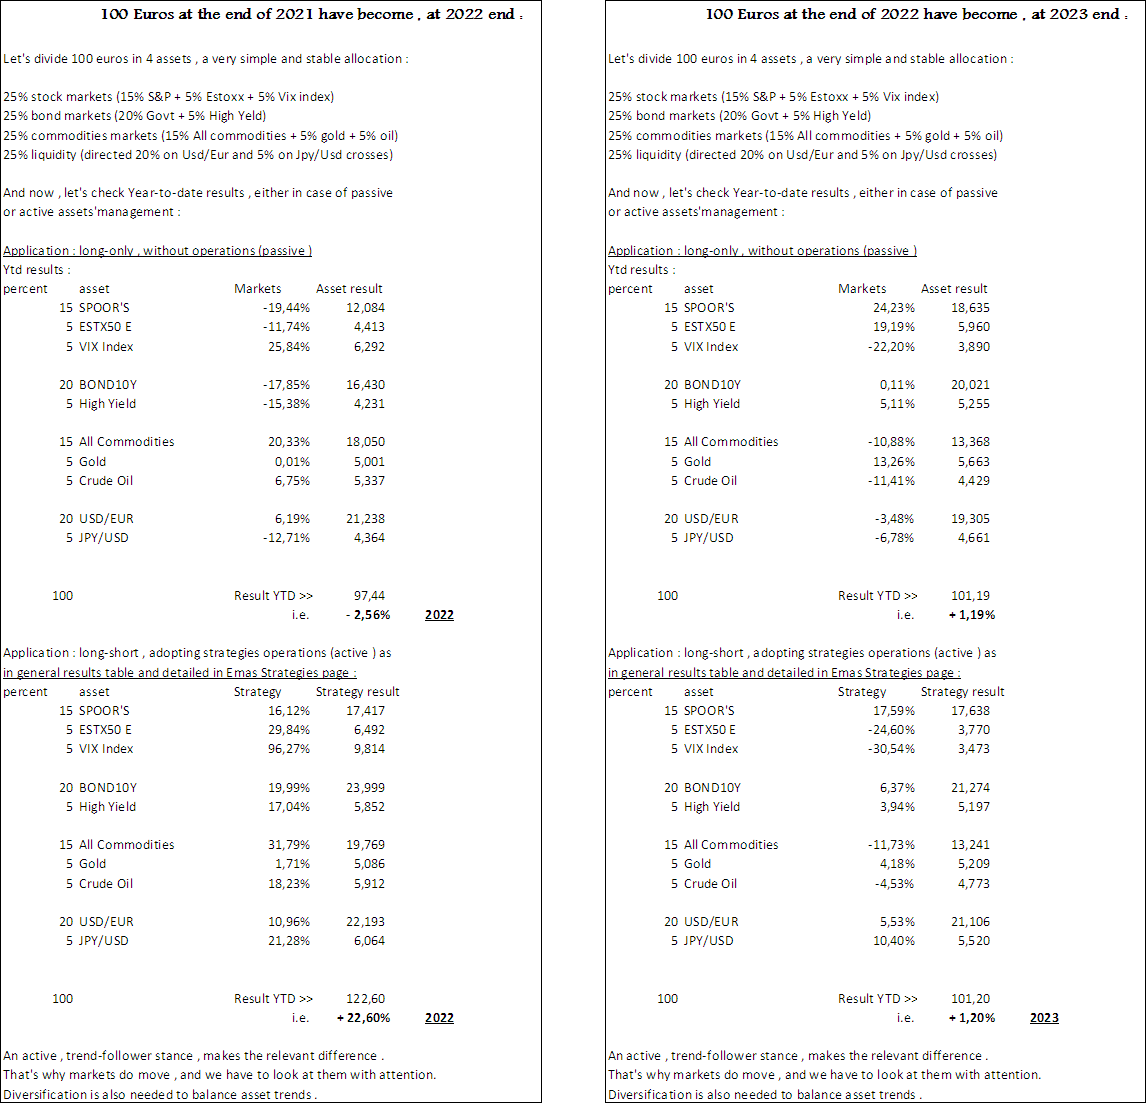
The table below presents a practical application .

Strategies’ base and scale
All strategies described on this site are based on proprietary algorithms , organized in spreadsheets and coded in VBA , with macro routines ; they can be easily converted in other languages (Python, R etc. ) . Every strategy has its relevant page , where points of intervention (buy and sell) are showed , to check how they work and when they act . For example , Equity Alpha Strategy page lists , at each week start , which stocks are selected to pursue strategy objectives . Futures page exhibits , for each day , assets to buy or shorten at following day’s open price (performances are obtained selling the asset at same day closing ) . Long-Short strategy page shows what assets are selected on a weekly base , with relevant stop-loss prices , or prices to enter a long position . EMAs strategy page , on a daily base , points out levels where opening or closing positions ; and so on . All that said , allowing everyone to check strategies’ performances in a clear and seamless way . Would you like to share strategies’ targets and/or to know how could they work for you ? Nothing easier : please contact us , ad hoc analysis requests address is : adhoc@marketstradingmood.com .