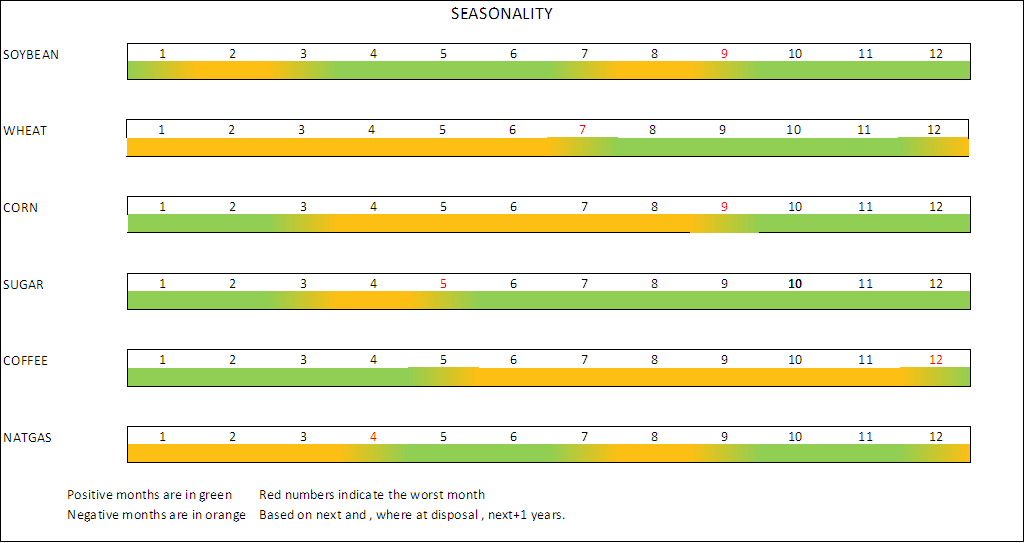
Four assets , among the most important , along with related options for Wti and S&P index, are shown below ; for eight assets , retracement levels are displayed too . Some basic materials , mainly agricultural , are known as “weather commodities” , whose quotations variate during the year for seasonal reasons , as for the end of this page . Quotes are updated at last working day . Be aware that , for options , is calculated the call/put ratio , and not put/call ( as more usual) .
Wti Oil and Natural Gas futures analysis

S&P index and Gold futures analysis

Futures daily strategy

Strategy results with last open/close intervention prices

Futures prices retracement levels
Charts below show , for eight assets , their recent nearby contracts highs and lows , and retracements levels (Fibonacci) ; horizontal lines are last (green) and last-1 (orange ) quotes , except for S&P and Nasdaq (only last , red). As usual, when green line is above the orange , last quotes were above the last-1 one (positive session).Open Interest and Volume variations are vs.previous day too .

Futures seasonality